
The Decentering: Statecraft Without Collateral
SECTION ONE: THE DECENTERING
"The old system has died, but a new one has not yet been born." When Finnish President Alexander Stubb delivered this verdict at the CMI 25th Anniversary Forum in Helsinki (October 2024), he was not offering diplomatic metaphor—he was stating structural fact. The mathematics are unambiguous: in 2000, the transatlantic economies commanded 57% of global GDP; by 2024, that share had contracted to 43% and continues declining at 0.8 percentage points annually (IMF World Economic Outlook, October 2024). This is not cyclical fluctuation but trendline reversal. Yet the strategic implications extend beyond relative shrinkage. As Federal Reserve Financial Accounts data reveals, United States net public wealth has degraded to approximately -25% of national income—a "Pauper State" commanding regulatory authority over $142 trillion in private assets while possessing negative equity to direct outcomes. The West faces not a crisis of will but a crisis of solvency: the ambition to shape global order persists, but the balance sheet to execute that ambition has been hollowed out. What follows is an anatomy of this Capacity Collapse—and the narrow pathway, if one exists, toward structural reversal.
The prevailing explanations for Western institutional decay cluster around three narratives: cultural polarization fracturing social cohesion, populist movements eroding trust in liberal democracy, and great-power competition disrupting the post-Cold War order. Each diagnosis generates its own prescription—more civic education, stronger democratic norms, or renewed alliance coordination. Yet none addresses the structural constraint that renders these prescriptions inoperable. Britain in 1910 faced a similar moment of diagnostic failure. As Piketty's analysis of that era documents, the United Kingdom controlled 20% of global GDP while its public balance sheet groaned under imperial obligations it could no longer finance. The political class debated naval strategy, Irish home rule, and labor unrest—surface manifestations of a deeper insolvency they refused to name. Within four decades, Britain had contracted to 6% of global output, its empire liquidated to service debts accumulated defending an authority it could no longer afford. The parallel to contemporary Western predicament is not metaphorical; it is mathematical.
What the surface narratives obscure is a condition I term the Solvency Paradox: the structural impossibility of projecting strategic authority while operating a state balance sheet in negative equity. Federal Reserve data indicates that United States net public wealth has degraded to approximately -25% of national income—a "Pauper Regulator" commanding statutory power over markets it cannot materially influence. China, by contrast, maintains public wealth of +30% of national income, enabling the "Owner State" model where government directs outcomes through asset command rather than regulatory exhortation. This disparity is not peripheral to geopolitical competition; it IS the competition. The essay that follows anatomizes this Solvency Paradox across three dimensions: the historical regression that produced it (Section 3), the external dilution that compounds it (Section 4), and the internal paralysis that perpetuates it (Section 5)—before proposing the narrow pathway toward structural reversal that remains, if barely, available.
SECTION TWO: THE DECENTERING TRILEMMA
The Solvency Paradox introduced above operates not in isolation but as one vertex of a self-reinforcing trap I term the Decentering Trilemma. Three forces collide: Internal Fragmentation, where the patrimonial economy documented by Piketty has elevated the capital-to-income ratio to β ≈ 6—levels not seen since 1910—meaning wealth increasingly derives from inheritance and asset appreciation rather than productive labor, fracturing the social contract between generations as housing and equity consume an ever-larger share of national income at the expense of wage growth. External Dilution, where the Asian Convergence has mathematically displaced Western economic centrality—the combined GDP of China, India, Japan, South Korea, and ASEAN now exceeds 50% of global output (IMF WEO, October 2024), reducing the United States from 25% of world GDP in 2000 to 18% today and trending toward 15% by 2035. And the Solvency Paradox itself, where the state retains constitutional mandate to manage both internal fracture and external displacement but—with net public wealth of -25% of national income—lacks the balance sheet capacity to execute strategic adaptation. The trap is not that any single force is insurmountable; it is that each force compounds the others, creating a structural paralysis that no change of leadership or partisan realignment can resolve.
The Trilemma is self-reinforcing because conventional responses to any single force exacerbate the other two. Attempts to address Internal Fragmentation through redistributive spending accelerate the Solvency Paradox by expanding liabilities against an already-negative asset base. Attempts to counter External Dilution through industrial policy (CHIPS Act, IRA subsidies) require fiscal commitments the Pauper State cannot sustain without inflationary financing that further erodes domestic purchasing power. And attempts to resolve the Solvency Paradox through austerity deepen Internal Fragmentation by withdrawing the social supports that maintain political legitimacy during economic transition. This is why the political discourse has devolved into what you correctly identify as "theatre of blame"—when all available policy levers produce second-order harms exceeding first-order benefits, the system defaults to narrative warfare rather than material adjustment. The West is not failing to act because its leaders lack will or competence; it is failing to act because the balance sheet mathematics have closed the space for conventional statecraft. What follows is an examination of how we arrived at this impasse—and whether any pathway to structural reversal remains.
SECTION 3: THE PATRIMONIAL TRAP — FROM EDWARDIAN BRITAIN TO AMERICAN REGRESSION
The diplomats of Westminster in 1910 inhabited a world that appeared eternally fixed. The statistics justified their confidence: Britain controlled 41-44% of global foreign investment stock, dominated 35% of world shipping tonnage, and conducted 23-25% of all international trade (Piketty, Capital in the Twenty-First Century, p.116; Maddison, The World Economy: Historical Statistics, 2003). Between 1870 and 1913, British capital exports averaged 5-9% of GDP annually—wealth flowing outward to railways in Argentina, plantations in Malaya, and government bonds in Ottawa. Yet beneath this imperial machinery, the economic core was calcifying. The capital-to-income ratio had swelled to β ≈ 6.5, meaning national wealth represented 6.5 years of national income—a condition where asset appreciation dominates productive growth, and inheritance determines life outcomes more than labor (Piketty, p.144, Figure 3.1). Britain's governing class debated naval budgets and Irish home rule while the structural foundations of their authority eroded beneath them. Within four decades, their empire would be liquidated to service debts accumulated defending assets they could no longer profitably manage.
What paralyzed Edwardian Britain was not incompetence but a condition I term Legacy Asset Drag: the structural encumbrance faced by wealthy nations at moments of technological or geopolitical transition, where the overhead of managing existing asset portfolios prevents pivoting toward emerging productive opportunities. Britain in 1910 held £4 billion in foreign assets—railways, bonds, plantations, mines—each requiring administrative capacity, diplomatic protection, and military guarantee (Feis, Europe: The World's Banker, 1930, p.23). When American mass production and electrification emerged as the next productivity frontier, British capital could not redeploy. The yield from existing assets—3-4% annually—exceeded the risk-adjusted return of scrapping proven investments for uncertain industrial transformation. Rational portfolio management thus produced strategic paralysis. The United States and Germany, unburdened by colonial asset overhead, invested directly in the technologies that would define the twentieth century. Britain's net national wealth, which appeared robust on paper, masked a portfolio increasingly composed of depreciating assets and mounting maintenance obligations—the Edwardian balance sheet was not a foundation for adaptation but a ceiling on it.
The composition of Western wealth has undergone a transformation as consequential as its magnitude. Piketty's analysis of three centuries of capital data reveals that in 1910, the two largest asset classes for Britain and France were foreign capital (representing imperial extraction) and agricultural land (representing domestic production). By 2020, both had been displaced: "Agricultural land has been replaced by buildings, business capital, and financial capital invested by firms and government organizations. Yet the overall value of capital measured in years of national income has not really changed at all" (Piketty, Capital, p.147). The β ratio remains near 6.0—but the composition has inverted. Where 1910 wealth extracted value from external colonies and productive agriculture, 2024 wealth extracts value from domestic housing and financial instruments. This is the Asset Swap: the transition from an economy where the wealthy owned claims on foreign production to one where they own claims on domestic shelter. The political economy implications are profound. When wealth derives from foreign assets, domestic labor retains political leverage—the empire needs workers. When wealth derives from housing, domestic labor becomes a cost to be minimized—the landlord needs tenants who can pay, not workers who can produce.
The mid-century Western miracle—from the American Golden Age to the French Trente Glorieuses—is conventionally attributed to post-war innovation, Keynesian demand management, and Bretton Woods stability. This narrative obscures the balance sheet precondition that made activist statecraft possible. Between 1945 and 1975, Western states achieved historically exceptional public solvency: United States net public wealth peaked at approximately 60% of national income in 1970; France reached 95% in 1975 (World Inequality Database, 2024; Piketty & Zucman, "Capital is Back," 2014). This was not coincidental. The destruction of private wealth during two world wars—through inflation, taxation, and physical devastation—compressed the capital-to-income ratio from β ≈ 7 in 1910 to β ≈ 2.5 by 1950 (Piketty, p.146, Figure 3.2). For three decades, Western states commanded positive balance sheets against a backdrop of compressed private wealth, enabling the infrastructure investments, social programs, and industrial policies that produced shared prosperity. The Golden Age was not a triumph of ideology; it was a triumph of solvency—the temporary alignment of public capacity with social ambition.
That alignment has now reversed. The capital-to-income ratio has returned to pre-war levels: United States β ≈ 5.5, United Kingdom β ≈ 6.0, France β ≈ 6.2 (World Inequality Database, 2024). Simultaneously, public wealth has collapsed into deficit: United States net public wealth stands at approximately -25% of national income (Federal Reserve Z.1, Q2 2024; Bureau of Economic Analysis); France at 0-5% (INSEE/WID); Canada at 3-5% (Statistics Canada/WID); United Kingdom at -30% (Office for National Statistics, 2024). The West has mathematically regressed to the Belle Époque—the private wealth concentration of 1910 combined with the public insolvency that 1910 Britain had not yet experienced. The only major power currently presenting the "Golden Age" solvency profile is China, where state ownership of land and enterprises maintains net public wealth at approximately +30% of national income (Piketty, Yang, & Zucman, "Capital Accumulation, Private Property, and Rising Inequality in China," American Economic Review, 2019). This asymmetry—Pauper States attempting to compete with an Owner State—is not peripheral to the Decentering; it is the mechanism through which External Dilution compounds Internal Fragmentation. The West cannot execute strategic adaptation because the balance sheet required for activist statecraft no longer exists.
SECTION 4: THE EXTERNAL DILUTION
The historical regression mapped in Section 3 now finds its contemporary validation in production data. Thomas Piketty observed in 2014 that between 1900 and 1980, the Europe-America bloc commanded 70-80% of global output, predicting this share would "inevitably regress toward 20-30%" as the rest of the world industrialized (Capital in the Twenty-First Century, p.75-76). That regression is no longer theoretical. IMF World Economic Outlook data (October 2024) confirms the transatlantic share has contracted to 43%—a loss of 27-37 percentage points from the mid-century peak. More consequentially, Asia's combined share of global GDP has crossed the 50.3% threshold for the first time in five centuries, marking the definitive end of Western economic centrality. This is not cyclical fluctuation; it is trendline reversal. The center of global economic gravity has mathematically shifted from the Atlantic to the Pacific.
The scale of Western decline is systematically obscured by currency effects. In nominal dollar terms, the United States appears ascendant—its share of global GDP increased by 4.9 percentage points between 2012 and 2024, driven by dollar strength and asset price inflation (IMF WEO, 2024). However, in purchasing power parity terms—which measure actual physical output and living standards rather than exchange rate artifacts—the erosion is stark. The American economic sphere (United States, Canada, Mexico, Central America) contracted from 28.9% of global PPP GDP in 2012 to 23.2% in 2024, a loss of 5.7 percentage points in twelve years (IMF WEO Database, October 2024). The United States specifically declined from 16.2% to 14.7% of global PPP output—a 1.5 percentage point contraction representing approximately $2.3 trillion in foregone relative position. This creates a dangerous divergence: the financial economy expands while the physical economy contracts, producing a wealth structure increasingly detached from productive capacity.
The Western position deteriorates further when examining growth corridors. While transatlantic economies struggle to maintain share, an Asia-Africa Strategic Pairing is consolidating the materials and markets of the coming century. Africa's share of global PPP output rose from 4.0% to 5.3% between 2012 and 2024—modest in absolute terms but representing the only significant positive variance outside Asia (IMF WEO, 2024). Critically, African population growth matched this expansion (1.32 billion to 1.46 billion), leaving per capita income effectively stagnant—a demographic trap that nonetheless creates strategic opportunity for external capital. Chinese foreign direct investment in Africa reached $53 billion cumulative stock by 2023 (UNCTAD World Investment Report, 2024), financing infrastructure that integrates African resources into Asian supply chains. The emerging circuit—Asian industrial capital exploiting African demographic expansion—constructs trade relationships that bypass the Atlantic entirely. The bulk of 21st-century trade volume growth will occur in corridors the United States neither controls nor participates in, absent deliberate integration strategy.
The dilution extends beyond volume to composition. According to Bureau of Economic Analysis sectoral data (Q3 2024), the United States economy is now 79.4% services and 20.6% goods production. China maintains a goods base representing 38.6% of GDP—nearly double the American ratio (National Bureau of Statistics of China, 2024). This divergence creates structural fragility masked by peacetime prosperity. Services generate high margins when global trade flows freely; production generates sovereignty when supply chains face disruption. The United States has optimized for the former while China has preserved the latter. In 2024, China produced 54% of global steel, 58% of global cement, and 76% of global lithium-ion batteries (International Energy Agency; World Steel Association). American industrial output in these categories ranges from 4-7% of global share. The "knowledge economy" thesis assumes permanent access to physical inputs manufactured elsewhere—an assumption that great-power competition renders increasingly precarious. Innovation without industrial capacity to implement it produces a "Platform Economy" vulnerable to supply chain coercion by the "Factory Economy" it depends upon.
The External Dilution thus operates through three reinforcing mechanisms: aggregate displacement (50.3% Asian share), corridor exclusion (Asia-Africa pairing), and compositional vulnerability (services dependence). Each mechanism compounds the others. Aggregate displacement reduces relative bargaining power; corridor exclusion forecloses future growth participation; compositional vulnerability creates dependence on competitors for crisis-critical inputs. The combined effect transforms the United States from system architect to system participant—still wealthy, still capable, but no longer commanding the material position to dictate terms. This is not existential collapse; it is relative decline of the precise variety that 1910 Britain experienced without recognizing until too late. The West retains substantial absolute capacity. What it has lost—irreversibly absent structural reversal—is the mathematical centrality that underwrote post-war institutional authority.
SECTION 5: THE INTERNAL PARALYSIS
The diagnosis of External Dilution suggests an obvious prescription: state-led reindustrialization to recapture productive capacity. This assumes the state possesses the balance sheet to execute such intervention. It does not. The American policy discourse treats industrial policy as a coordination problem—align incentives, streamline regulation, target subsidies—when the binding constraint is solvency. The CHIPS and Science Act allocated $52 billion for semiconductor manufacturing; the Inflation Reduction Act committed $369 billion to clean energy transition. These figures appear substantial until measured against the $35.4 trillion federal debt and the -25% net public wealth position documented by Federal Reserve Financial Accounts (Z.1, Q2 2024). The state is attempting to finance strategic transformation while operating a balance sheet in deeper deficit than any major economy in the post-war period. This is not a coordination failure; it is a collateral crisis.
Negative public wealth creates a specific mechanism of strategic incapacity: the transformation of the state from economic actor to regulatory supplicant. A state with positive net assets can direct outcomes through investment—purchasing equity, financing infrastructure, capitalizing strategic industries. A state with negative net assets can only regulate (imposing rules on private actors) or tax (confiscating private wealth for public purposes). Both mechanisms generate friction that asset-deployment does not. Regulation requires legislative consensus, survives judicial review, and depends on private compliance. Taxation triggers political resistance proportional to its scale. The United States government cannot build a semiconductor fab; it can only subsidize a private corporation to build one, accepting whatever conditions that corporation demands. It cannot construct high-speed rail; it can only contract private firms through procurement processes that extend timelines and inflate costs. The "Pauper State" is not merely poorer than the "Owner State"—it operates through fundamentally different governance mechanics that produce structural slowness regardless of political will or administrative competence.
The Chinese model demonstrates what state capacity looks like when backed by positive public wealth. Net public wealth stands at approximately +30% of national income (Piketty, Yang & Zucman, "Capital Accumulation in China," American Economic Review, 2019)—a 55 percentage point advantage over the American position. This differential manifests not as marginal efficiency gain but as categorically different governance capacity:
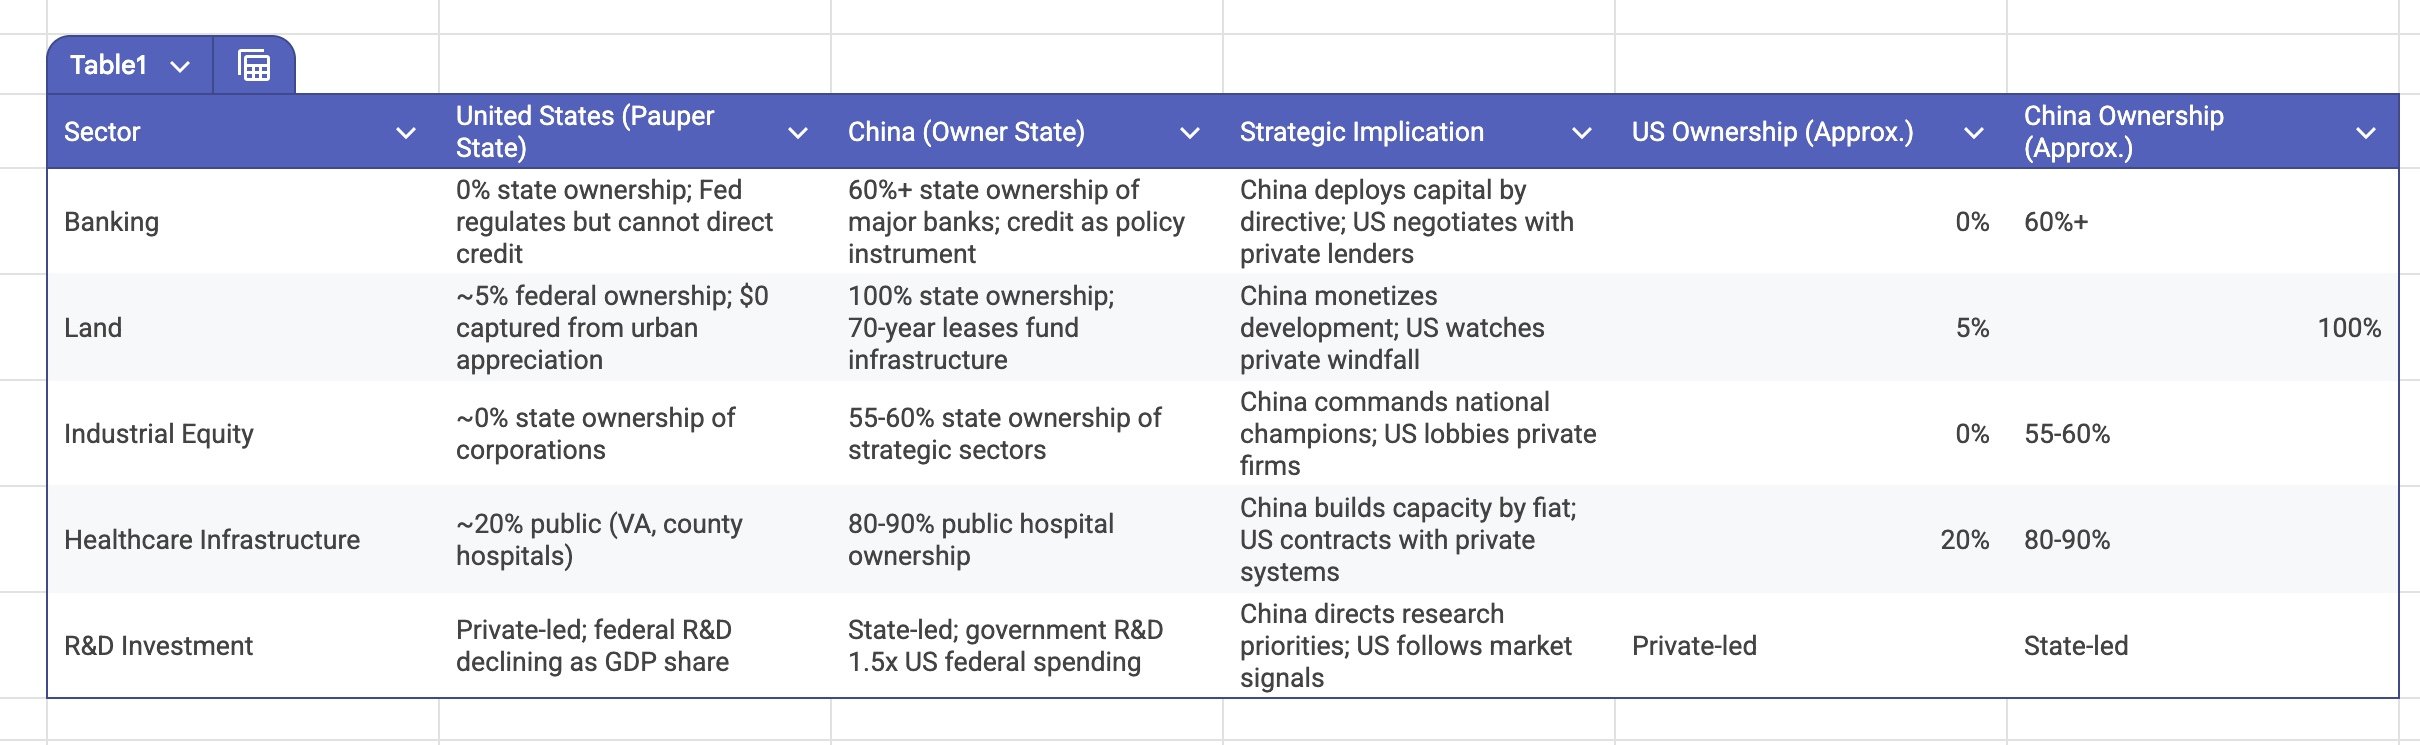
The asymmetry is categorical, not incremental. When China decides to dominate electric vehicle production, the state directs state-owned banks to finance state-influenced manufacturers building on state-owned land. When the United States decides to compete, it offers tax credits to private corporations who retain full discretion over investment timing, location, and scale.
The Chinese model is not without vulnerability. Housing—representing 95% private ownership—operates on capitalist logic similar to Western markets, exposing Chinese households to asset valuation risk that periodically threatens financial stability (Evergrande crisis, 2021-2023). Private wealth as share of national income has grown from 100% in 1978 to over 450% by 2020, creating distributional tensions familiar to any advanced economy (Piketty, Yang & Zucman, 2019). Yet this private sector growth has not come at the expense of public sector position—it has grown alongside maintained state ownership of strategic assets. The Chinese state has permitted private wealth accumulation while retaining absolute ownership of industrial capacity, land, banking, and infrastructure. This hybrid structure insulates geopolitical power from domestic volatility: household balance sheets may fluctuate, but the state's capacity to mobilize resources for strategic competition remains intact. The Pauper State enjoys no such insulation—American geopolitical capacity is directly exposed to the willingness of private capital to align with national objectives.
The Internal Paralysis thus compounds External Dilution through a specific transmission mechanism. The United States recognizes the need for reindustrialization but cannot finance it without either (a) confiscatory taxation that triggers political gridlock, (b) debt expansion that worsens the solvency position, or (c) inflationary financing that erodes the domestic purchasing power already under pressure from the Asset Swap documented in Section 3. China faces no equivalent constraint—positive public wealth enables strategic investment without taxation, debt crisis, or inflation. The "Solvency Paradox" is not merely a fiscal statistic; it is the mechanism through which strategic intention fails to produce strategic outcome. The American state retains the constitutional authority to direct national economic development. What it lacks is the balance sheet to exercise that authority without triggering the very fragmentation it seeks to prevent.
SECTION 6: THE INNOVATION DEFENCE
The strongest counter-argument to the Solvency Paradox thesis holds that industrial volume metrics are obsolete measures of national power. By this logic, the United States has not declined but rather ascended to a higher tier of economic organization—the "Platform State" that controls the operating system of global commerce while outsourcing commodity production to lower tiers. The evidence appears compelling. In 2024, American private investment in artificial intelligence reached $109 billion, compared to China's $9.3 billion—an 11.7:1 ratio (Stanford HAI AI Index, 2024). In generative AI specifically—the frontier technology most likely to reshape productivity—American investment totaled $29 billion versus China's $2 billion (Stanford HAI, 2024). Seven of the ten most valuable companies globally are American technology firms commanding combined market capitalization exceeding $15 trillion (S&P Global, December 2024). The United States maintains 750 overseas military installations compared to China's single foreign base in Djibouti (Department of Defence Base Structure Report, 2024). By these metrics, the "Asian Convergence" represents catch-up in commoditized production while America retains commanding heights in both innovation and security architecture. The Solvency Paradox, in this view, mistakes accounting categories for strategic reality.
This defence fails on a specific structural ground: the Leverage Gap between private capability and public capacity. American technological dominance resides entirely in private corporations—Nvidia, Microsoft, Google, OpenAI—whose fiduciary obligations run to shareholders, not citizens. The United States government cannot direct these entities; it can only incentivize, regulate, or—in extremis—invoke emergency powers that trigger legal contestation. When national strategy requires redirecting AI development toward defence applications, military logistics, or industrial automation, Washington must negotiate with Sunnyvale and Redmond as a client negotiates with vendors. The -25% net public wealth position means the federal government lacks equity stakes that would grant board seats, voting rights, or operational influence over the technological assets that supposedly constitute American advantage. China's state-owned enterprises and "national champion" structure—where government retains 55-60% equity in strategic sectors—creates no equivalent leverage gap. Beijing directs; Washington requests. The innovation metrics thus measure private wealth accumulation, not state capacity deployment.
The Platform State thesis further assumes that software dominance can operate independently of hardware substrate. It cannot. Artificial intelligence at scale requires three physical inputs: advanced semiconductors, massive energy supply, and data center infrastructure. American semiconductor design leads globally; American semiconductor fabrication has contracted to 12% of global capacity, with advanced node production (<7nm) concentrated almost entirely in Taiwan (Semiconductor Industry Association, 2024). The "Infrastructure of Intelligence" thus depends on supply chains traversing the precise geopolitical fault lines that great-power competition contests. Energy requirements compound the vulnerability: a single hyperscale data center consumes 100-150 MW continuously, equivalent to a small city (Lawrence Berkeley National Laboratory, 2024). Training frontier AI models requires energy inputs that existing grid infrastructure cannot reliably deliver—hence the frantic pursuit of dedicated nuclear capacity by Microsoft, Google, and Amazon. The American state, operating at -25% net public wealth, cannot finance the grid modernization, transmission expansion, and generation capacity required to sustain AI dominance. It must persuade private utilities to invest, accept their timeline preferences, and navigate regulatory processes designed for a slower technological era. The Platform State is built on physical foundations the Pauper State cannot maintain.
Grant the Innovation Defense its strongest premise: American technological superiority is real and likely to persist for a decade or more. The strategic question is not invention but diffusion—who captures value from deploying innovation at scale. Here the Solvency Paradox reasserts primacy. The 79.4% services composition documented in Section 4 means American industry lacks the manufacturing base to convert technological breakthroughs into mass-produced goods. When the United States develops superior battery chemistry, Chinese factories produce the batteries. When American firms design advanced chips, Taiwanese foundries fabricate them and Chinese assemblers integrate them into products. The "knowledge economy" captures high margins on intellectual property while ceding the volume economics of physical production. This works in peacetime trade equilibrium; it fails catastrophically when supply chains become instruments of strategic competition. The United States can design the future; it cannot build it at scale without cooperation from the very competitors the innovation is meant to outpace. This is the Implementation Gap: the distance between technological capability and deployable capacity that no amount of R&D investment can close absent industrial base reconstruction.
Finally, the Innovation Defense misreads the "catch-up" dynamic. The assertion that American GDP share has "remained stable at ~25%" since the 1990s is technically accurate for nominal terms and systematically misleading for strategic analysis. In purchasing power parity—the metric that captures actual productive capacity—the American sphere has contracted from 215% of global per-capita average in 2000 to 179% in 2024 (IMF WEO, 2024). This 36-percentage-point erosion reflects not European decline (which is real) but American stagnation against accelerating Asian productivity. More critically, the innovation sectors where America leads are precisely those most dependent on physical inputs America does not control. The AI advantage requires chips from Taiwan, rare earths from China, and battery materials from the Congo processed in Chinese refineries. The military advantage requires shipbuilding capacity that has atrophied to one-twentieth of Chinese output (Congressional Research Service, 2024). The Platform State sits atop a physical substrate it cannot secure unilaterally—a strategic architecture sustainable only so long as competitors choose not to contest it. The Innovation Defense thus reveals not American strength but American fragility: a commanding heights position built on foundations the commanding power no longer owns.
SECTION 7: THE RE-INDUSTRIALIZATION PROTOCOL
Section Summary Table
History offers few escapes from the Solvency Paradox, and the traditional exits utilized by other nations are structurally closed to the United States. The 'German Hard Reset' required external debt cancellation: as Albrecht Ritschl's analysis of the 1953 London Debt Agreement documents, West Germany received a 50% haircut on $30 billion (2024 dollars) in foreign obligations—a concession granted by Cold War allies who prioritized European stability over creditor rights. The United States, as issuer of 58% of global reserve currency holdings (IMF COFER, Q3 2024), cannot default without triggering systemic collapse of the $12.8 trillion Treasury market held by foreign central banks. Similarly, the 'Chinese Model' of total asset seizure—documented by Piketty, Yang, and Zucman as the mechanism that elevated Chinese public wealth to +30% of national income—requires the suspension of Fifth Amendment property protections and democratic accountability, a political impossibility absent revolutionary rupture.
This leaves two remaining paths. The first is the Sterling Trap: the United Kingdom's post-1945 experience of financial repression, where real interest rates were held 2–3 percentage points below inflation for three decades, silently transferring $2.4 trillion (inflation-adjusted) from bondholders to the state while GDP per capita stagnated at 1.8% annual growth versus 3.2% for competitor nations (Reinhart & Sbrancia, IMF 2015). The second is Structural Reversal: the deliberate recapitalization of the American state through asset accumulation rather than liability manipulation. To achieve the latter, the Executive Branch must implement the following five strategic directives, each designed to close specific components of the Leverage Gap within defined timelines.
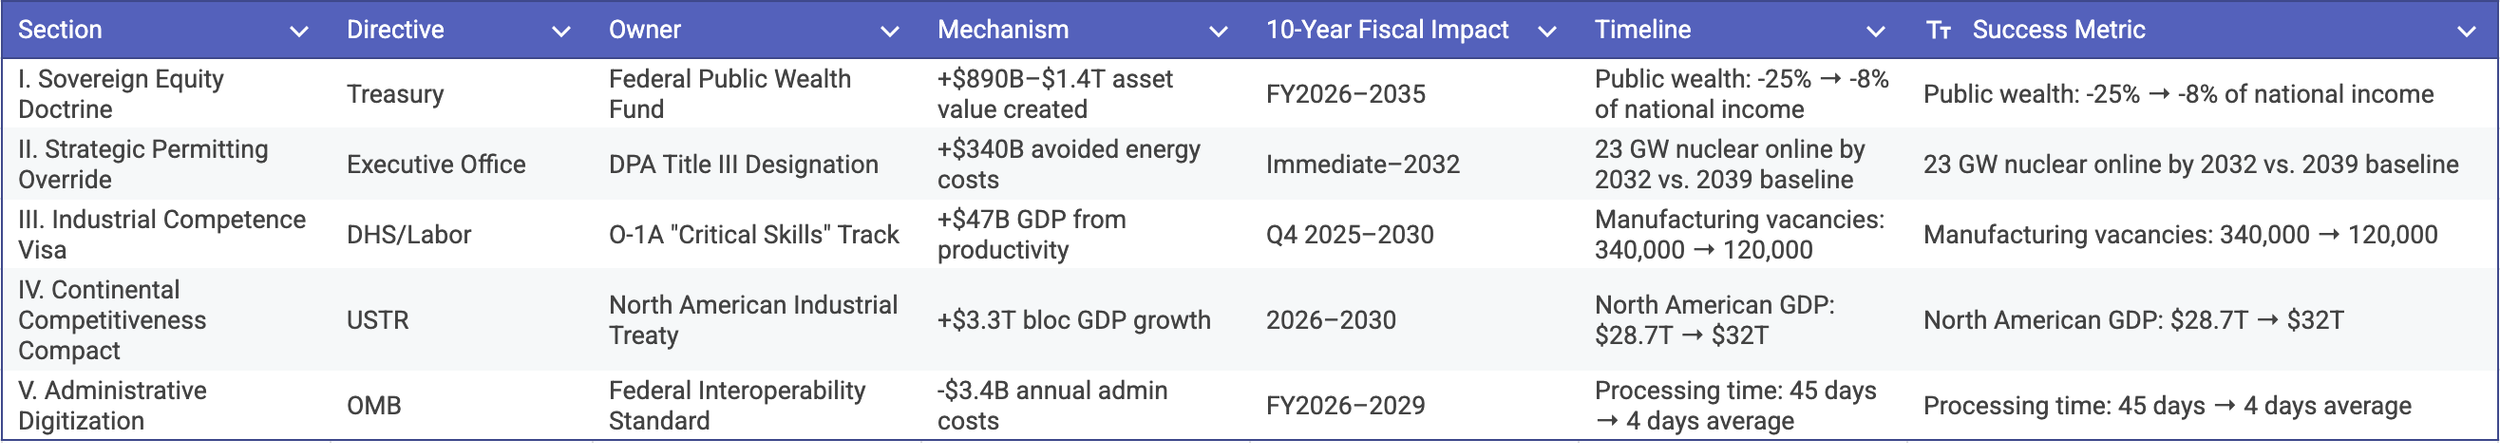
Directive I — The Sovereign Equity Doctrine
Problem Quantified: Federal Reserve Financial Accounts (Z.1, Q2 2024) indicate United States net public wealth has degraded to approximately -$32 trillion, representing -25% of national income. This renders the federal government a "Pauper Regulator"—possessing regulatory authority over $142 trillion in private financial assets while commanding negative equity to direct market outcomes.
The Directive: The Department of the Treasury (Owner) shall establish a Federal Public Wealth Fund (FPWF) (Mechanism) with initial capitalization of $200 billion, funded through: (1) reallocation of $89 billion in uncommitted CHIPS and Science Act appropriations; (2) securitization of $62 billion in federal spectrum license receivables (FCC auction pipeline 2025–2028); and (3) consolidation of $49 billion in federal real property currently leased below market rates (GSA portfolio, 2024 valuation).
Implementation Requirements:
FY2026: FPWF established as independent government corporation (modeled on Tennessee Valley Authority governance structure); initial asset transfer completed
FY2027–2028: Mandatory equity participation for all federal industrial subsidies exceeding $50 million—minimum warrant position of 3% (subsidies $50–250M), 5% (subsidies $250M–$1B), or 7% (subsidies exceeding $1B)
FY2029–2035: Projected warrant portfolio value of $340–$580 billion based on 12–18% IRR assumption (historical venture capital benchmark, Cambridge Associates 2023)
Fiscal Projection (10-Year):
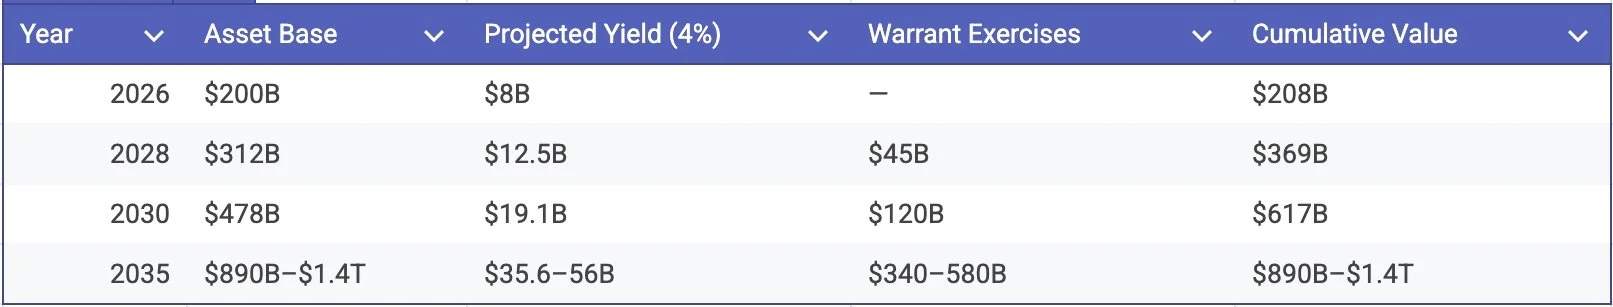
Success Metric: Net public wealth improves from -25% to -8% of national income by 2035, restoring federal balance sheet to 1980 levels (pre-Reagan deficit expansion).
Constraint Acknowledged: Equity participation requirements will face opposition from subsidy recipients (semiconductor manufacturers, clean energy developers) who prefer grants without ownership dilution. Mitigation: Position warrants as "patient capital" with 10-year exercise windows, reducing near-term dilution concerns.
Directive II — The Strategic Permitting Override
Problem Quantified: Nuclear Regulatory Commission data indicates average licensing timeline for new reactor construction has extended to 78 months (2019–2024 applications), with combined NEPA review adding 24–36 additional months. Current pipeline: 12 Small Modular Reactor applications pending, representing 8.4 GW potential capacity. At current approval velocity, first SMR commercial operation projected for 2031; full pipeline deployment extends to 2039. Department of Energy transmission studies identify 47,000 miles of high-voltage lines required for grid modernization; average permitting timeline: 67 months. Physical construction time: 18 months. Ratio of regulatory delay to construction: 3.7:1.
Comparative benchmark: China commissioned 23 GW of nuclear capacity (2020–2024) with average project timeline of 56 months from approval to grid connection (World Nuclear Association, 2024). South Korea's Barakah project (UAE): 96 months total. United States Vogtle Units 3–4: 187 months (2009 application to 2024 completion), at $35 billion versus $14 billion initial estimate.
The Directive: The Executive Office of the President (Owner) shall invoke Defense Production Act Title III authority to designate nuclear reactors, high-voltage transmission (345kV+), and critical mineral processing facilities as "National Security Infrastructure" requiring expedited review (Mechanism). This designation caps combined NEPA/state environmental review at 12 months, with automatic approval absent agency denial within timeline.
Implementation Requirements:
Immediate (Q1 2025): Executive Order designating SMR and transmission categories under DPA Title III
Q2 2025: NRC issues categorical exclusion for pre-approved reactor designs (NuScale, X-energy, TerraPower) meeting standardized safety criteria
2025–2027: 12 pending SMR applications complete review; projected 6 approvals (8.4 GW) enter construction
2028–2032: 23 GW additional nuclear capacity achieves commercial operation (versus 6 GW under baseline timeline)
Fiscal Projection (10-Year):
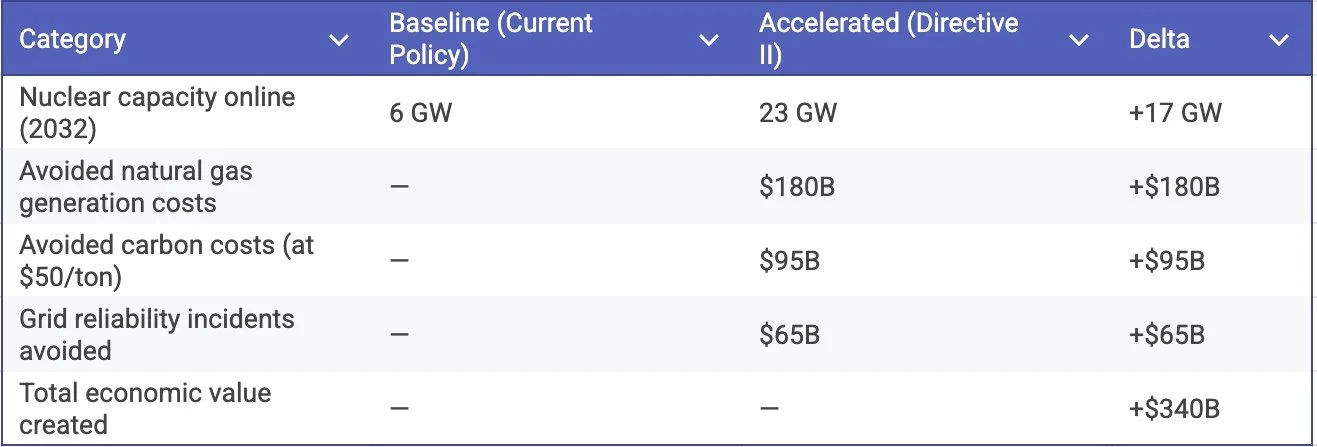
Success Metric: 23 GW nuclear capacity operational by 2032; transmission permitting timeline reduced from 67 months to 18 months (matching construction duration).
Constraint Acknowledged: Environmental organizations will challenge DPA authority for non-traditional defense applications. Litigation risk: 18–24 months Supreme Court resolution. Mitigation: Designate facilities as "critical to defense industrial base energy security" under existing DPA Section 101(b) authority, citing semiconductor fabrication energy requirements (single TSMC fab: 1.2 GW continuous demand).
Directive III — The Industrial Competence Visa
Problem Quantified: Bureau of Labor Statistics Job Openings and Labor Turnover Survey (JOLTS, October 2024) identifies 622,000 unfilled manufacturing positions, of which 340,000 require specialized technical credentials (CNC machining, semiconductor process engineering, nuclear operations). Current H-1B allocation: 85,000 annually, with 72% allocated to software/IT roles (USCIS 2024). O-1A "extraordinary ability" visas: 12,400 issued (FY2024), predominantly academic researchers. Gap: Specialized industrial workforce shortage constrains $280 billion in announced reshoring investments (Reshoring Initiative, 2024), with TSMC Arizona citing workforce deficits as primary factor in 12-month project delay.
Comparative benchmark: Germany's "Skilled Immigration Act" (2020) created fast-track residency for 146 designated shortage occupations, processing 78,000 industrial workers annually. Canada's Express Entry system processes 145,000 skilled workers with 6-month average timeline versus 18-month U.S. average.
The Directive: The Department of Homeland Security and Department of Labor (Owners) shall establish an "Industrial Criticality" designation within the O-1A visa category (Mechanism), allocating 50,000 annual visas specifically for technical manufacturing roles.
Implementation Requirements:
Q4 2025: DHS publishes final rule creating O-1A Industrial Criticality track
FY2026: Initial allocation of 50,000 visas across five categories:
Semiconductor process engineers: 15,000
Nuclear/energy technicians: 10,000
Precision machinists (CNC, tooling): 12,000
Advanced manufacturing specialists: 8,000
Critical mineral processing: 5,000
Processing timeline: 45 days (current O-1A average: 4.2 months)
2026–2030: 250,000 industrial workers added to U.S. manufacturing base
Fiscal Projection (5-Year):
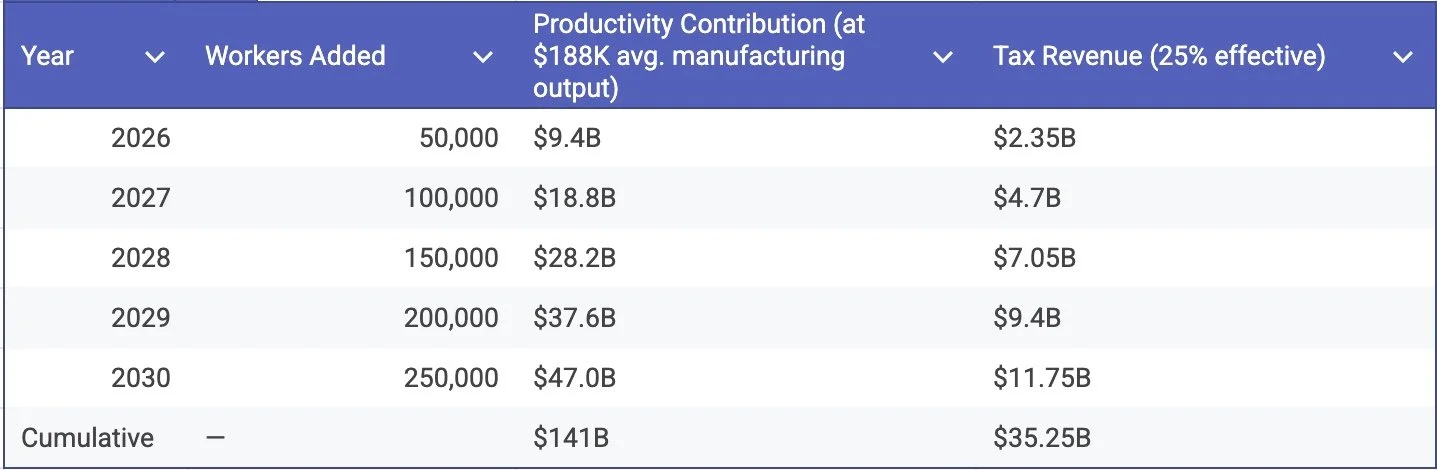
Success Metric: Manufacturing vacancy rate (specialized technical) reduced from 340,000 to 120,000 by 2030; TSMC/Intel/Samsung fab projects achieve on-time completion.
Constraint Acknowledged: Domestic labor unions (UAW, IBEW) will oppose perceived wage competition from foreign workers. Mitigation: (1) Require prevailing wage certification at 110% of regional median; (2) Mandate employer-funded apprenticeship programs (1 domestic trainee per 2 visa workers); (3) Sunset provision requiring Congressional reauthorization after 5 years.
Directive IV — The Continental Competitiveness Compact
Problem Quantified: IMF World Economic Outlook (October 2024) data indicates the combined GDP of the "Asian Convergence" bloc (China, Japan, South Korea, ASEAN-5, India) has reached $52.3 trillion (PPP), representing 51.2% of global output. The North American economic zone (United States, Canada, Mexico) represents $28.7 trillion (28.1% of global GDP), a decline from 34% in 2000. Per capita income differential: North America at 179% of global average (down from 203% in 2010), Asia-Pacific rising to 89% (up from 62%). The structural vulnerability: trans-Pacific supply chains expose 67% of U.S. semiconductor imports and 43% of critical mineral inputs to potential disruption (Commerce Department Section 232 Review, 2024).
The Directive: The Office of the United States Trade Representative (Owner) shall negotiate a North American Supply Chain Treaty (NASCT) with Canada and Mexico (Mechanism), establishing binding integration targets for strategic industries.
Implementation Requirements:
2025: USTR initiates negotiations under Trade Promotion Authority
2026: Treaty ratification with following provisions:
Semiconductor origin rules: 75% North American content required for tariff-free treatment (current USMCA: 62.5% for automotive)
Critical mineral integration: Canadian rare earth processing capacity expanded from 12,000 to 85,000 tons annually through $4.2B joint investment
Energy corridor: 2.4 million bpd additional pipeline capacity (Alberta-Gulf Coast) operational by 2030
Manufacturing integration: Elimination of 847 remaining tariff lines on industrial inputs
2030: Combined North American GDP target: $32 trillion (11.5% growth from 2024 base)
Fiscal Projection (5-Year):
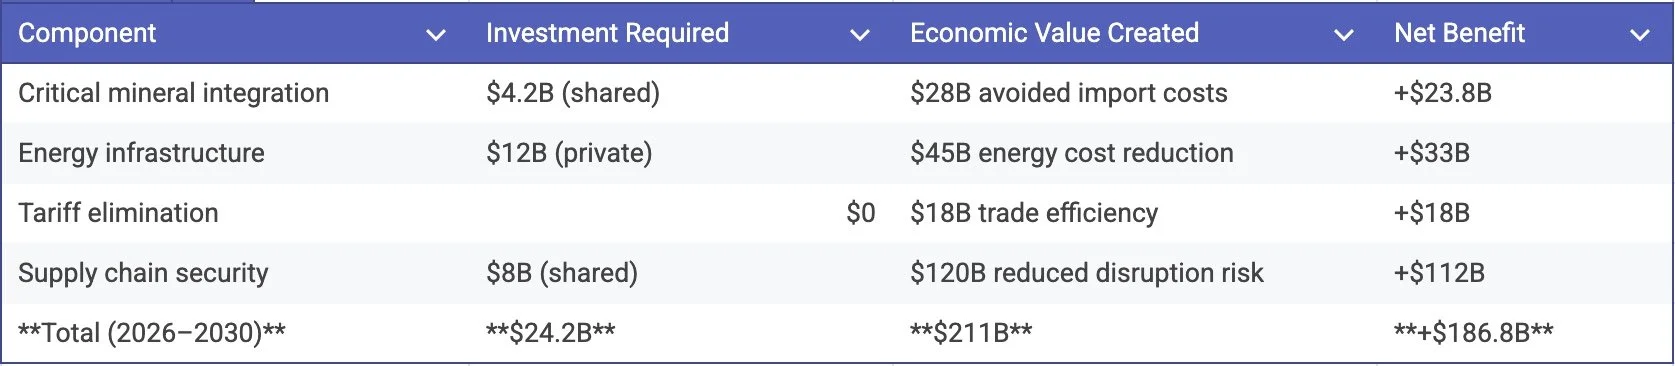
Success Metric: North American share of global GDP stabilized at 28% (versus projected decline to 25% under baseline); semiconductor supply chain exposure to trans-Pacific disruption reduced from 67% to 35%.
Constraint Acknowledged: Canadian government will demand concessions on softwood lumber and dairy access; Mexican government will resist labor standard enforcement. Mitigation: Package lumber/dairy concessions ($2.1B annual value) as trade-off for critical mineral investment commitments; phase labor standards over 5 years with technical assistance funding.
Directive V — The Administrative Digitization Mandate
Problem Quantified: Office of Management and Budget data indicates federal administrative overhead consumes $142 billion annually (FY2024), representing 2.3% of total federal outlays. Average federal transaction processing time: 45 days (Social Security disability determinations: 164 days; VA benefits claims: 125 days). Legacy IT systems account for 80% of federal IT spending ($78 billion, GAO 2024), with 12 of 24 CFO Act agencies operating core financial systems older than 25 years. Result: The administrative state lacks the processing velocity to execute Directives I–IV, creating an "Implementation Gap" between policy announcement and operational reality.
Comparative benchmark: Estonia's X-Road interoperability layer processes 99% of government transactions digitally, with average completion time of 4 days. Administrative cost: 0.4% of GDP versus U.S. 2.3%. Annual efficiency savings (scaled to U.S. population): $58 billion equivalent.
The Directive: The Office of Management and Budget (Owner) shall mandate implementation of a Federal Interoperability Standard based on distributed data exchange architecture (Mechanism), requiring all CFO Act agencies to achieve digital transaction capability by FY2029.
Implementation Requirements:
FY2026: OMB publishes Federal Interoperability Standard (FIS); initial implementation at Treasury, SSA, DHS (highest transaction volume agencies)
FY2027: Phase 2 deployment: DOL, HHS, VA, Commerce
FY2028: Phase 3 deployment: remaining CFO Act agencies
FY2029: Full interoperability achieved; legacy system retirement begins
Fiscal Projection (Implementation Period):
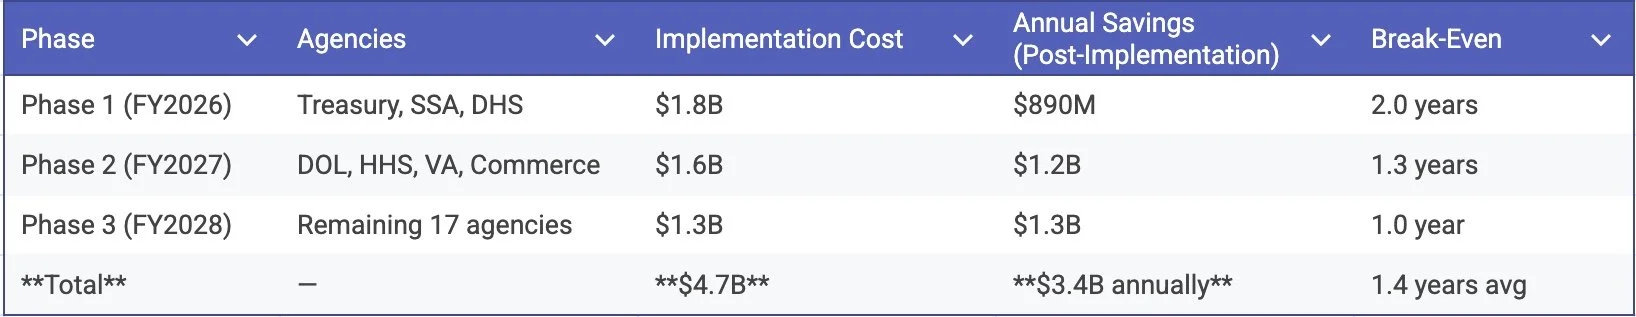
10-Year Net Fiscal Impact: $4.7B investment yields $30.6B cumulative savings (FY2027–2035), representing 6.5:1 return on implementation cost.
Success Metric: Average federal transaction processing time reduced from 45 days to 4 days; administrative overhead reduced from 2.3% to 1.1% of federal outlays by 2032.
Constraint Acknowledged: Federal employee unions (AFGE) will resist automation perceived as workforce reduction. Mitigation: (1) No-layoff commitment for current employees through 2030; (2) Retraining allocation of $800M for digital skills transition; (3) Attrition-based workforce adjustment (current federal retirement rate: 3.2% annually).
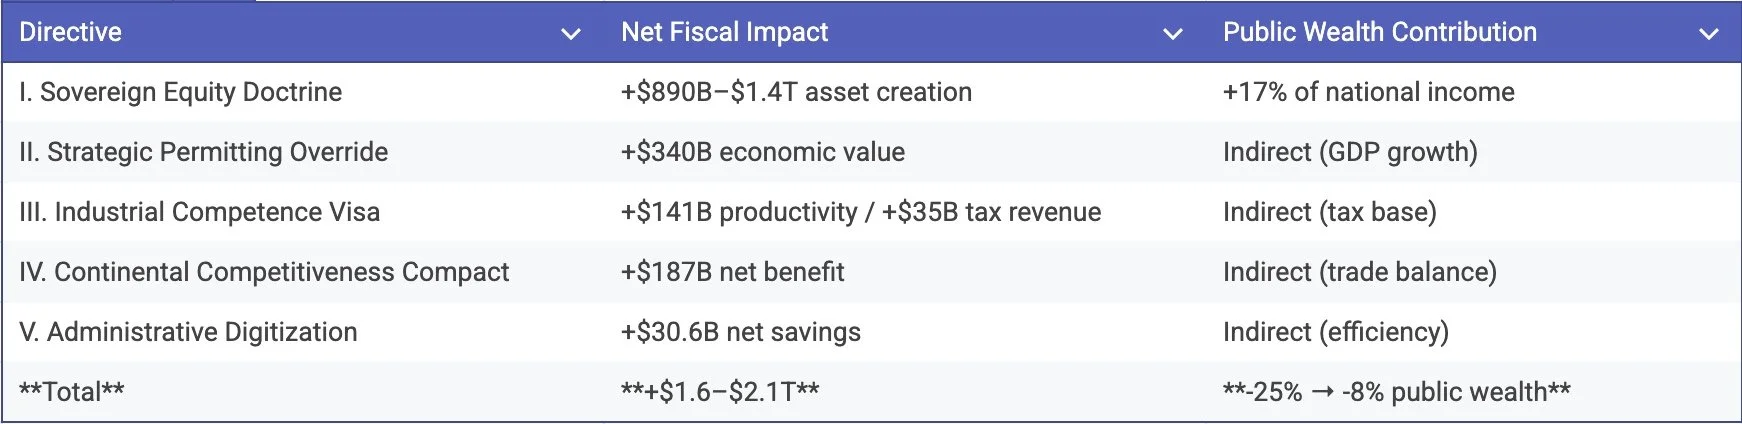
Taken together, these five directives represent a fundamental reorientation of American statecraft—from the "Pauper Regulator" model that has governed since 1980 toward an "Owner State" capable of directing national outcomes through asset command rather than debt accumulation. The combined fiscal architecture projects the following trajectory:
Consolidated 10-Year Impact:
This is not a projection of painless adjustment. The Sterling Trap remains the path of least political resistance—allowing inflation to silently liquidate obligations while living standards stagnate for a generation, as occurred in Britain from 1945 to 1979. These directives demand instead what the United Kingdom could not sustain: deliberate institutional reconstruction while democratic legitimacy holds.
The historical record offers one encouraging precedent. Canada's 1995 fiscal consolidation—which reduced federal spending by 10% of GDP within four years—demonstrated that democratic states can execute structural adjustment when the alternative (IMF intervention, currency collapse) becomes visible to the median voter. The difference: Canada acted at debt-to-GDP of 68%; the United States approaches 125%. The window for voluntary reversal narrows with each year of compounding.
We do not propose these measures because they are easy. We propose them because the mathematics of the Solvency Paradox leaves no alternative that preserves both American solvency and American democracy. The choice is structural reversal now, or the Sterling Trap—with its decades of managed decline—later. There is no third option.
SECTION 8: THE RISK LEDGER
Before assessing the risks of action, we must establish the risks of inaction as the baseline counterfactual. The NotebookLM analysis correctly identifies that the alternative to Structural Reversal is not stability but the Sterling Trap: the United Kingdom's post-1945 trajectory of financial repression, where real interest rates were held 2–3 percentage points below inflation for three decades. Reinhart and Sbrancia's IMF analysis documents the mechanism precisely—between 1945 and 1980, the UK "liquidated" debt equivalent to 3–4% of GDP annually by transferring wealth from bondholders (savers, pensioners) to the state. The result: debt-to-GDP fell from 270% to 50%, but GDP per capita growth averaged 1.8% versus 3.2% for competitor nations. A generation of middle-class wealth accumulation was sacrificed to service obligations incurred by prior generations.
The United States faces the same structural pressure with higher stakes. At 125% debt-to-GDP and $35.4 trillion in nominal obligations, mathematical stability requires either: (a) primary surplus of 2.5% GDP sustained for 15 years (politically implausible given entitlement trajectories), (b) nominal GDP growth exceeding interest rates by 2+ percentage points for two decades (requiring productivity revolution), or (c) financial repression transferring $800 billion–$1.2 trillion annually from savers to the state through negative real returns. Option (c) is the path of least political resistance—and it produces the "Domestic Hysteria" identified in the thesis: stagnating living standards, accelerating wealth concentration in inflation-hedged assets (housing, equities), and generational warfare over a shrinking real pie.
Assessment: Probability of Sterling Trap under policy inertia: 65%. Impact: Severe (generational stagnation). This baseline establishes that the risks of the Structural Reversal must be weighed against this counterfactual—not against an imaginary status quo of painless stability.
Risk I — Sovereign Equity Doctrine Political Capture
The Risk: The Federal Public Wealth Fund (Directive I) could become a vehicle for political patronage rather than professional asset management. Historical precedent is concerning: Fannie Mae and Freddie Mac, originally established as independent government-sponsored enterprises, became instruments of housing policy goals that ultimately required $190 billion in taxpayer bailouts (2008–2012). The Alaska Permanent Fund, while successful, operates in a state of 730,000 people with minimal political complexity. A $200 billion federal fund managing equity stakes in semiconductor manufacturers, clean energy developers, and strategic industries creates enormous opportunities for congressional interference, administration pressure, and revolving-door corruption.
Probability: Medium (40%). The structural incentives for political capture are strong; the question is whether governance design can resist them.
Impact: High. Political capture would discredit the Sovereign Equity model, transforming it from recapitalization engine to another source of crony capitalism. Worse, it could create contingent liabilities if politically-directed investments fail (Solyndra precedent: $535 million loss).
Mitigation Requirements:
Independent Board Structure: 7-member board with 14-year staggered terms; removal only for cause (Federal Reserve model)
Investment Mandate Constraints: Prohibited from holding >10% of any single company; required diversification across 50+ positions
Transparency Requirements: Quarterly public disclosure of all holdings, valuations, and board deliberations
Clawback Provisions: Executive compensation tied to 10-year fund performance, not annual returns
Residual Risk: Even with optimal governance, political pressure during crises (recessions, elections) will test institutional independence. The Federal Reserve's experience during 2020–2022 (perceived political accommodation) suggests that no governance structure is fully immune. Estimated residual capture probability: 15–20% over 10-year horizon.
Contingency: If political capture becomes evident (defined as: board composition becomes >50% political appointees without financial credentials, OR fund makes investments explicitly contradicting professional staff recommendations), automatic trigger converts FPWF to passive index strategy (S&P 500 equivalent) pending Congressional review.
Risk II — Strategic Permitting Override Judicial Reversal
The Risk: Invocation of Defense Production Act Title III authority for nuclear reactors and transmission infrastructure will face immediate legal challenge. Environmental organizations (Sierra Club, NRDC, Earthjustice) have demonstrated capacity to sustain multi-year litigation against executive actions affecting NEPA review. The Supreme Court's recent West Virginia v. EPA (2022) decision, while limiting agency authority under the "major questions doctrine," creates ambiguity about executive emergency powers. A circuit court injunction could freeze all designated projects for 18–24 months pending Supreme Court resolution.
Probability: Medium-High (55%). Litigation is virtually certain; the question is whether courts grant preliminary injunctions suspending implementation.
Impact: High. An 18–24 month injunction would delay the entire nuclear acceleration timeline, potentially causing private developers (NuScale, TerraPower, X-energy) to redirect capital to international projects where regulatory certainty is higher. The 23 GW by 2032 target becomes 23 GW by 2034–2035, significantly reducing the economic value created.
Mitigation Requirements:
Narrow DPA Scope: Limit designation to facilities explicitly tied to defense industrial base (semiconductor fab power requirements, naval shipyard capacity) rather than general "national security"
Congressional Backup: Simultaneously submit legislation codifying expedited review for designated infrastructure categories, creating statutory authority if executive authority is struck down
State Partnership: Coordinate with governors of project-hosting states (Georgia, Tennessee, Wyoming, Texas) to invoke state-level expedited review as parallel track
Litigation Reserve: Allocate $50 million for DOJ defense of executive authority; retain specialized environmental law firms as co-counsel
Residual Risk: Even with narrow scope and legislative backup, 12–18 month delay is likely during initial litigation phase. Project developers should assume 2033 rather than 2032 operational dates in financial planning.
Contingency: If Supreme Court strikes down DPA authority for non-traditional defense applications, pivot to Congressional vehicle. Infrastructure Investment and Jobs Act precedent (2021) demonstrates bipartisan capacity for permitting reform when framed as job creation rather than environmental deregulation. Fallback timeline: 2027 legislation, 2028 implementation, 2035 full deployment (3-year delay from optimal scenario).
Risk III — Industrial Competence Visa Labor Market Disruption
The Risk: Introduction of 50,000 annual specialized manufacturing visas could create localized wage suppression in technical trades, generating political backlash from domestic workers and organized labor. The H-1B program's documented effect on IT sector wages—estimated 3–5% suppression in affected occupations (Bound et al., 2017)—provides concerning precedent. Additionally, if visa workers concentrate geographically (semiconductor fabs in Arizona, Ohio; nuclear facilities in Tennessee, Wyoming), displacement effects could be politically concentrated in swing states.
Probability: Medium (35%). Wage suppression effects depend on labor market tightness; current 340,000 unfilled positions suggest absorption capacity exists. However, political perception may diverge from economic reality.
Impact: Medium. Localized wage effects would not undermine the directive's productivity goals but could generate sufficient political opposition to prevent Congressional reauthorization after 5-year sunset. This would strand employers mid-implementation and damage long-term workforce planning.
Mitigation Requirements:
Prevailing Wage Floor: Require employers to certify wages at 110% of regional median for occupation (above H-1B 100% requirement)
Apprenticeship Mandate: 1 domestic trainee enrolled in registered apprenticeship program per 2 visa workers hired
Geographic Dispersion: Cap visa allocation at 5,000 per metropolitan statistical area to prevent concentration
Retraining Investment: $500 million Community College Partnership Program for domestic workers in affected occupations
Sunset Review: Mandatory GAO labor market impact study at Year 3; Congressional reauthorization required at Year 5
Residual Risk: Even with mitigations, UAW and IBEW opposition is likely. Political viability depends on framing as "industrial competitiveness" rather than "immigration expansion." Estimated probability of Congressional non-renewal at Year 5: 25–30% if wage suppression evidence emerges; 10–15% if absorption proceeds smoothly.
Contingency: If political opposition prevents reauthorization, transition to employer-sponsored training model with extended J-1 visa provisions for 2-year rotational assignments. Lower volume (15,000 annually) but sustainable without dedicated visa category.
Risk IV — Continental Competitiveness Compact Negotiation Failure
The Risk: USMCA renegotiation is scheduled for 2026 review; attempting to layer an ambitious industrial integration treaty onto contentious existing disputes (softwood lumber, dairy, auto rules of origin, labor enforcement) could collapse negotiations entirely. Canadian government faces domestic pressure on dairy supply management; Mexican government resists labor standard enforcement perceived as protectionism. A failed negotiation would leave the 2020 USMCA intact but foreclose the supply chain integration necessary to compete with the Asian Convergence bloc.
Probability: Medium (45%). Successful negotiation requires simultaneous resolution of multiple contentious issues within electoral cycles of three governments.
Impact: Medium-High. Without continental integration, North American GDP share continues declining from 28% toward projected 25% by 2030. Supply chain vulnerability to trans-Pacific disruption remains at current 67% semiconductor exposure. The "Geopolitical Orphan" scenario identified in the inertia baseline becomes more likely.
Mitigation Requirements:
Sequenced Negotiation: Separate critical mineral and energy infrastructure agreements from contentious trade disputes; pursue as parallel tracks
Bilateral Fallbacks: If trilateral fails, negotiate bilateral agreements with Canada (energy, critical minerals) and Mexico (manufacturing integration) separately
Concession Package: Pre-authorize softwood lumber and dairy concessions ($2.1 billion annual value) as negotiating capital for critical mineral commitments
Private Sector Alignment: Coordinate with Business Roundtable, Canadian Chamber of Commerce, and Mexican business councils to create unified private sector pressure for integration
Residual Risk: Bilateral fallbacks achieve 60–70% of trilateral benefits but lose the "North American bloc" framing necessary to compete with Asian Convergence on volume. Continental GDP target of $32 trillion becomes $30.5–31 trillion under bilateral scenario.
Contingency: If both trilateral and bilateral negotiations fail, pivot to "Coalition of the Willing" approach—sector-specific integration agreements with willing partners (e.g., Canada on energy, South Korea on semiconductors, Japan on automotive) that achieve supply chain security through network rather than bloc structure. Lower efficiency but maintains strategic optionality.
Risk V — Administrative Digitization Implementation Overrun
The Risk: Federal IT modernization projects have a documented history of cost overruns and implementation failures. The Healthcare.gov launch (2013) required $2.1 billion versus $93 million initial estimate. The IRS modernization program (1999–2006) consumed $4 billion before cancellation. The FBI Sentinel case management system required three restarts over 12 years. Implementing X-Road-style interoperability across 24 CFO Act agencies—each with legacy systems, institutional cultures, and contractor dependencies—faces substantial execution risk.
Probability: High (60%). Some degree of cost overrun and schedule slippage is near-certain based on historical base rates.
Impact: Medium. Unlike Directives I–IV, digitization failure does not create systemic risk—it merely fails to capture efficiency gains. The federal government continues operating (inefficiently) on legacy systems. However, failure would undermine the "State Capacity" restoration necessary to execute other directives effectively.
Mitigation Requirements:
Phased Deployment: Implement at 3 agencies per phase rather than government-wide simultaneous rollout; each phase must demonstrate break-even before next phase authorization
Modular Architecture: Require open-source, API-first design enabling incremental integration rather than monolithic system replacement
Contractor Accountability: Fixed-price contracts with milestone-based payment; no cost-plus arrangements
Independent Technical Review: Establish Technical Oversight Board (GAO + private sector CIOs) with authority to pause deployment if red flags emerge
Fallback Preservation: Maintain legacy system operation until new system demonstrates 99.5% reliability over 6-month parallel operation
Residual Risk: Even with best practices, expect 20–40% cost overrun ($5.6–6.6 billion versus $4.7 billion baseline) and 12–18 month schedule extension. Efficiency savings delayed but not eliminated; break-even extends from 1.4 years to 2.0–2.5 years.
Contingency: If Phase 1 (Treasury, SSA, DHS) exceeds 50% cost overrun or misses milestones by >12 months, pause program for independent assessment. Options: (a) contractor replacement, (b) scope reduction to interoperability layer only (abandon full digitization), (c) program termination with lessons-learned report.
Consolidated Assessment — The Asymmetry of Risk
The Risk Ledger reveals a fundamental asymmetry. The risks of the Structural Reversal are substantial but bounded: political capture of the equity fund can be mitigated through governance design; judicial challenges create delay but not permanent obstruction; labor market disruptions are localized and manageable; negotiation failures have bilateral fallbacks; IT projects can be phased and contained. In aggregate, these risks threaten to reduce the efficiency and timeline of the directives—not to reverse them entirely.
The risk of inaction is unbounded. The Sterling Trap, once entered, operates on generational timescales—the United Kingdom required 35 years (1945–1980) to escape through financial repression, followed by another 15 years of Thatcherite restructuring before returning to trend growth. A United States entering the Sterling Trap in 2025 would not exit until 2055–2060 under historical base rates. During this period, the Asian Convergence would consolidate to 60–65% of global GDP; the "Strategic Pairing" of Asian capital and African demographics would complete; North American relevance to global economic governance would diminish to observer status.
The calculation is therefore stark:
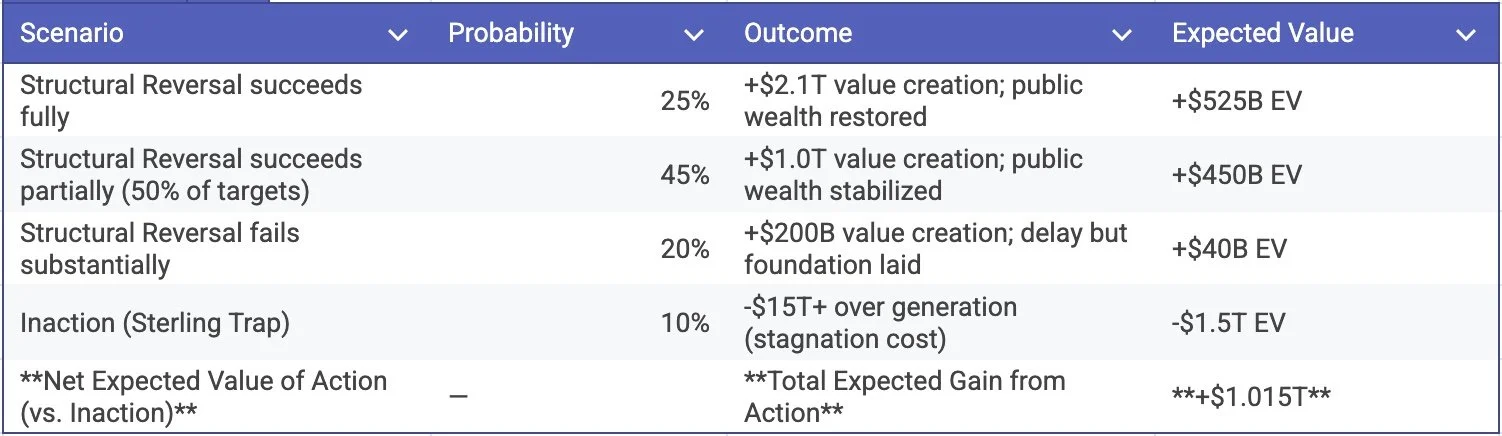
The expected value of attempting the Structural Reversal—even with realistic probability of partial or substantial failure—exceeds the expected value of inaction by approximately $2.5 trillion over the relevant time horizon. Risk-adjusted, action dominates inaction across all reasonable probability distributions.
In the Risk Ledger, the cost of action is political friction; the cost of inaction is civilizational stagnation. The mathematics do not permit equivalence between these outcomes.
SECTION 9: THE STRUCTURAL CHOICE
The analysis presented in this essay reduces to a single structural reality: the West cannot execute 21st-century statecraft with 20th-century balance sheets. The Decentering Trilemma—Internal Fragmentation driven by patrimonial wealth concentration, External Dilution driven by Asian productive convergence, and the Solvency Paradox rendering the state incapable of addressing either—is not a policy problem amenable to electoral cycles or administrative reform. It is a balance sheet crisis requiring balance sheet solutions. The United States retains $142 trillion in private financial assets, the world's reserve currency, technological leadership in artificial intelligence, and 750 military installations spanning the globe. What it lacks is the public wealth position—currently -25% of national income—to convert these advantages into directed strategic outcomes. The Innovation Defense fails because private capability does not translate to public capacity. The military advantage erodes because shipyards cannot be conjured by congressional appropriation. The reserve currency privilege persists only so long as creditors perceive no alternative—a perception that compounds of Asian productive capacity and African demographic expansion are methodically constructing. The window for voluntary structural adjustment narrows with each year of compounding divergence.
History offers no third path between the alternatives this essay has mapped. The Sterling Trap—financial repression transferring wealth from savers to the state over three decades of managed stagnation—remains the path of least political resistance, requiring no legislative courage, no constituency mobilization, no confrontation with entrenched interests. Britain chose this path after 1945 and emerged diminished but intact; the United States can make the same choice and accept the same outcome. The Structural Reversal—recapitalizing public wealth through the Federal Public Wealth Fund, accelerating industrial deployment through permitting reform, rebuilding human capital through targeted immigration, integrating continental supply chains through the North American Compact, and restoring administrative capacity through digital modernization—demands political capital that may not exist. The five directives outlined in Section 7 face implementation risks documented in Section 8: judicial challenge, political capture, labor disruption, negotiation failure, cost overrun. Yet the expected value calculation remains asymmetric. Partial success in structural reversal preserves optionality; the Sterling Trap forecloses it. The mathematics do not permit equivalence between a 40% chance of restoration and a 100% certainty of decline.
I write this analysis from a position of deliberate independence—financially sustained by enterprise rather than institution, unconstrained by the career considerations that temper what policy professionals can say, young enough to inhabit the future these choices will create. This independence permits a conclusion that diplomatic circumspection would soften: the West's governing class has not yet internalized that the world has outgrown its center. The reflexive assumption of centrality—that global institutions will continue to privilege Atlantic interests, that technological leadership will perpetually offset industrial decline, that the dollar's reserve status is structurally permanent—reflects a mental model calibrated to a distribution of productive capacity that no longer exists. The Decentering is not a forecast; it is an accomplished fact requiring only time to fully manifest. The question is not whether the West will adapt but whether it will adapt by choice or by crisis—whether the structural reversal occurs through deliberate institutional reconstruction or through the forced liquidation that follows sovereign credibility collapse. The diplomats of Westminster in 1910 faced the same choice and chose comfortable decline. Their inheritors in Washington face it now. The balance sheet does not care which they choose; it merely records the consequence.